
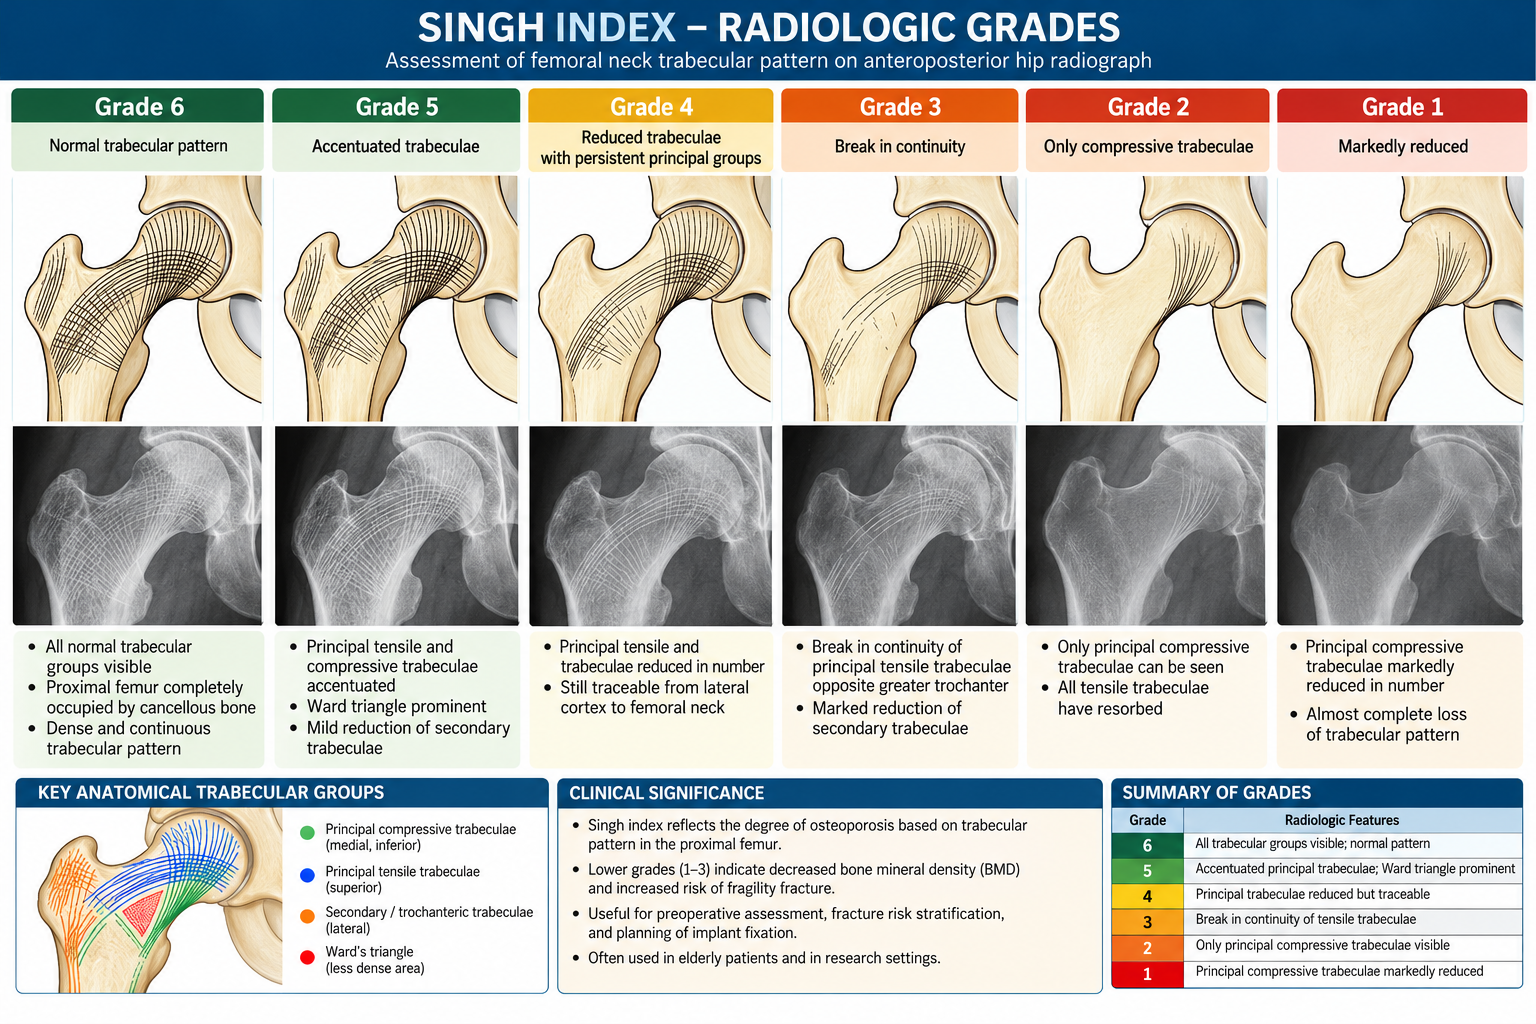
This picture shows the Singh index, a six-grade system that describes loss of the internal supporting bone in the upper femur—the thigh bone near the hip—on a plain X-ray. Read it from grade 6 at the top left toward grade 1 at the bottom right: the lower the number, the fewer supporting bone structures remain visible. It is a classic way to recognize patterns associated with osteoporosis, but it is not a sufficiently reliable stand-alone test for diagnosing it.
1. What structures are you looking at?
Each panel shows the same part of the upper femur:
- The femoral head is the rounded “ball” at the upper right, which fits into the hip socket.
- The femoral neck is the narrower bridge connecting the head to the shaft.
- The greater trochanter is the prominent projection on the outer side, toward the left of each drawing.
- The cortex is the dense outer shell.
The fine curved lines inside represent trabeculae: small plates and struts of cancellous, or spongy, bone. The Singh index focuses on these internal structures rather than simply measuring the thickness of the outer shell.
The illustration is a simplified architectural drawing, not an actual X-ray. Its lines represent groups of trabeculae, rather than individual fibers or blood vessels.
2. Why does the bone have these curved internal lines?
The femoral neck carries load between the body and the leg. Because it projects at an angle from the shaft, loading produces a combination of compression and bending. Its trabeculae form organized supporting systems adapted to these mechanical demands. Think of them as the internal framework of a bridge, rather than random material filling a hollow space.
Principal compressive trabeculae
These form a relatively dense, upright, fan-shaped group extending from the inner, or medial, side of the proximal femur through the neck toward the weight-bearing part of the head. They help transmit compressive loading and are the last major group to remain conspicuous in the lower Singh grades. In the picture, look for the relatively upright curved bundle beneath the femoral head that remains visible even in grades 2 and 1.
Principal tensile trabeculae
These form an arch extending from the outer side of the proximal femur near the greater trochanter, across the neck, and into the head. In the traditional biomechanical description, this system helps resist tensile stresses associated with bending of the femoral neck. In the picture, follow the long curved lines sweeping from the left-hand side toward the rounded head. The reduction and eventual interruption of this arch are central to distinguishing grades 4 and 3.
Secondary supporting groups
Additional compressive, tensile, and trochanteric trabecular groups complete the internal network. These finer supporting structures become less visible as bone loss progresses, leaving the principal groups increasingly isolated. The terms “compressive” and “tensile” describe the traditional mechanical organization of these groups; together they form an interconnected three-dimensional structure, which a plain X-ray displays as a two-dimensional projection.
3. What is Ward’s triangle?
Ward’s triangle is a relatively sparse region of trabecular bone in the femoral neck, between the major supporting bundles. It is a normal anatomical region—not a fracture, cyst, or abnormal hole. As surrounding fine trabeculae become less conspicuous, this region looks more clearly defined. That is why the grade 5 caption says “Ward triangle prominent.” The important finding is increasing contrast between the remaining major bundles and the relatively empty-looking space between them.
4. Explanation of each grade
The table follows the order shown in your picture. These are architectural descriptions; the clinical labels are traditional interpretations, not substitutes for a bone-density assessment.
Grade What the picture shows How to understand it
- 6 All normal trabecular groups are visible, with a dense, interconnected network throughout the upper femur. The most preserved trabecular pattern in this classification.
- 5 The principal tensile and compressive groups stand out, while Ward’s triangle becomes prominent. Some finer background structure is less apparent, so the main bundles look more distinct. “Accentuated” does not mean that the bone has become stronger.
- 4 The principal tensile trabeculae are markedly reduced, but their course can still be followed from the lateral cortex toward the femoral neck. The arch is thinner, but still continuous.
- 3 There is a break in the visible continuity of the principal tensile group near the side opposite the greater trochanter. The key change is loss of continuity, not merely thinning. This is the traditional threshold for an osteoporotic pattern.
- 2 Only the principal compressive trabeculae remain conspicuous; most other groups are no longer visible. The supporting network has been markedly simplified.
- 1 Even the principal compressive trabeculae are greatly reduced and no longer prominent. The most advanced trabecular loss depicted by this scale.
- Grade 6 → 5: loss of the background framework
At grade 6, the network looks richly filled in. At grade 5, the principal bundles appear more prominent partly because the surrounding finer trabeculae have diminished. This is a relative prominence, not an increase in their strength or bone content. - Grade 5 → 4: thinning of the tensile arch
The principal tensile group becomes substantially reduced, but you can still trace a continuous path across the neck. The useful visual question is: “Can I still follow the arch?” In grade 4, the answer is yes. - Grade 4 → 3: interruption of the tensile arch
This is the most important distinction to recognize in the diagram: - Grade 4: thin but continuous.
- Grade 3: visibly interrupted.
The phrase “break in continuity” refers to the trabecular pattern. It does not, by itself, mean that the person has a femoral-neck fracture. A fracture and loss of visible trabecular continuity are different findings.
Grade 3 → 2 → 1: loss of the remaining major support
At grade 2, the principal compressive group remains the dominant visible structure. At grade 1, even this group is markedly reduced. Notice that the outer outline is still drawn in all panels: this diagram emphasizes the loss of internal architecture rather than showing every change that osteoporosis can cause.
5. Why does this pattern matter?
Bone strength depends not only on how much bone is present but also on how it is arranged. Losing cross-connections and continuity makes the internal framework less effective, even if some prominent supporting bundles remain. The Singh index attempts to capture this architectural deterioration visually.
A bridge analogy is useful:
- Grade 6 resembles a framework with major beams and many connecting braces.
- Grades 5–4 resemble a framework losing smaller braces and thinning its main arch.
- Grade 3 shows interruption of that arch.
- Grades 2–1 leave progressively fewer major supports.
This is an analogy for understanding the picture, not a calculation of an individual’s fracture risk.
6. Does grade 3 or below prove osteoporosis?
In the traditional Singh classification, grades 3 and below are described as “definite osteoporosis.” That is the historical interpretation of the pattern, and it explains why grade 3 is often emphasized in teaching.
In modern clinical practice, however, a Singh grade alone should not be treated as definitive proof. A systematic review found inconsistent performance compared with dual-energy X-ray absorptiometry, usually called DXA or DEXA, and substantial problems with agreement between observers. Some studies found useful correlations, while others found poor diagnostic reliability.
There are two important consequences:
A low Singh grade can raise concern and justify further evaluation, but it cannot reliably determine a person’s exact bone mineral density.
A relatively preserved pattern cannot reliably exclude osteoporosis.
Modern assessment therefore favors DXA-based bone mineral density, interpreted with the person’s clinical circumstances, rather than assigning a diagnosis or treatment solely from this drawing or a Singh grade. There is no dependable one-to-one conversion between a Singh grade and a DXA T-score
References:
- Kalavakonda V, Mohamed S, Abhay L, Muthu S. Automated Screening of Hip X-rays for Osteoporosis by Singh’s Index Using Machine Learning Algorithms. Indian J Orthop. 2024 Aug 25;58(10):1449-1457. doi: 10.1007/s43465-024-01246-9. PMID: 39324087; PMCID: PMC11420408.
- Ghalenavi E, Mirfeizi Z, Hashemzadeh K, Sahebari M, Joker MH. Diagnostic Value of Radiographic Singh Index Compared to Dual-Energy X-Ray Absorptiometry Scan in Diagnosing Osteoporosis: A Systematic Review. Arch Bone Jt Surg. 2024;12(1):1-11. doi: 10.22038/ABJS.2023.70632.3309. PMID: 38318309; PMCID: PMC10838578.